




















These All-Sky Images Reveal the Universe Across Different Wavelengths
Oct 4, 2026
Soumyadeep Mukherjee
Soumyadeep Mukherjee is an award-winning astrophotographer from India. He has a doctorate degree in Linguistics. His work extends to the sub-genres of nightscape, deep sky, solar, lunar and optical phenomenon photography. He is also a photography educator and has conducted numerous workshops. His works have appeared in over 40 books & magazines including Astronomy, BBC Sky at Night, Sky & Telescope among others, and in various websites including National Geographic, NASA, Forbes. He was the first Indian to win “Astronomy Photographer of the Year” award in a major category.
Share:
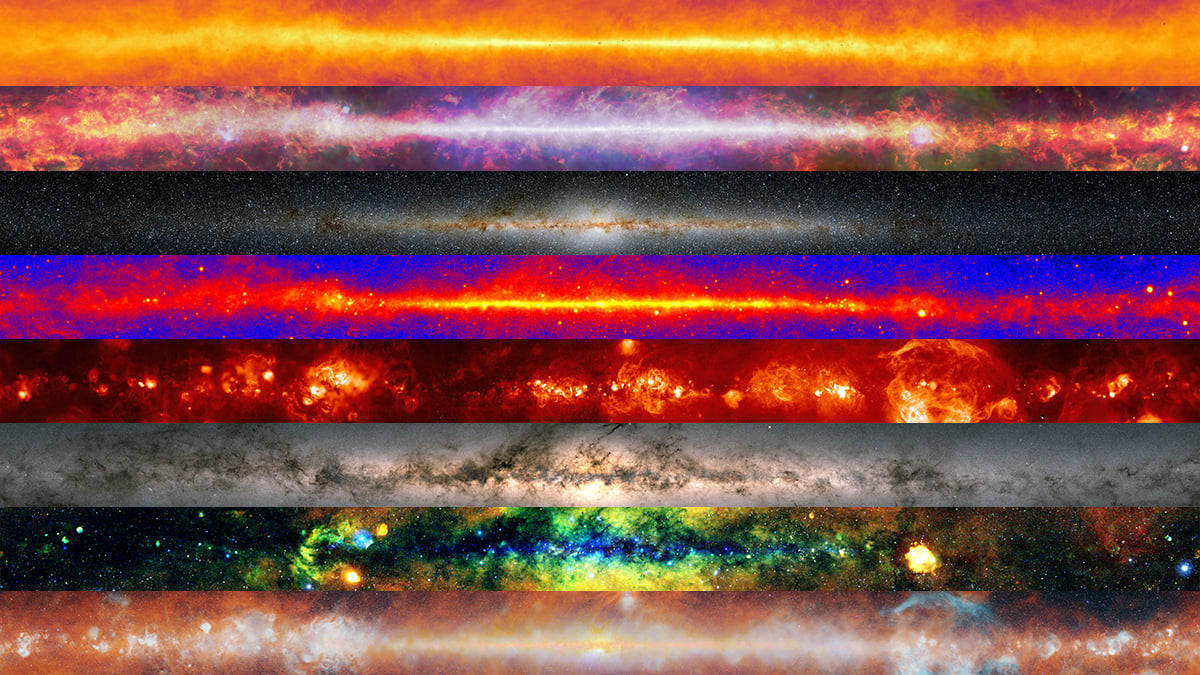
Look at a wide-field photograph of the Milky Way, and you will see thousands of stars packed across the sky. Dark dust lanes cut through the bright star fields, while glowing nebulae appear along the Galactic plane. Now imagine taking the same picture using X-rays, gamma rays, radio waves, microwaves, and infrared light. You will get completely different views.
That is what eight all-sky maps from NSF NOIRLab allow us to explore. Each image uses data from a different astronomical survey or mission. The collection includes maps from eROSITA, NASA’s Fermi Gamma-ray Space Telescope, ESA’s Gaia mission, Planck, 2MASS and NASA’s newer SPHEREx mission.
eROSITA maps the sky in X-rays
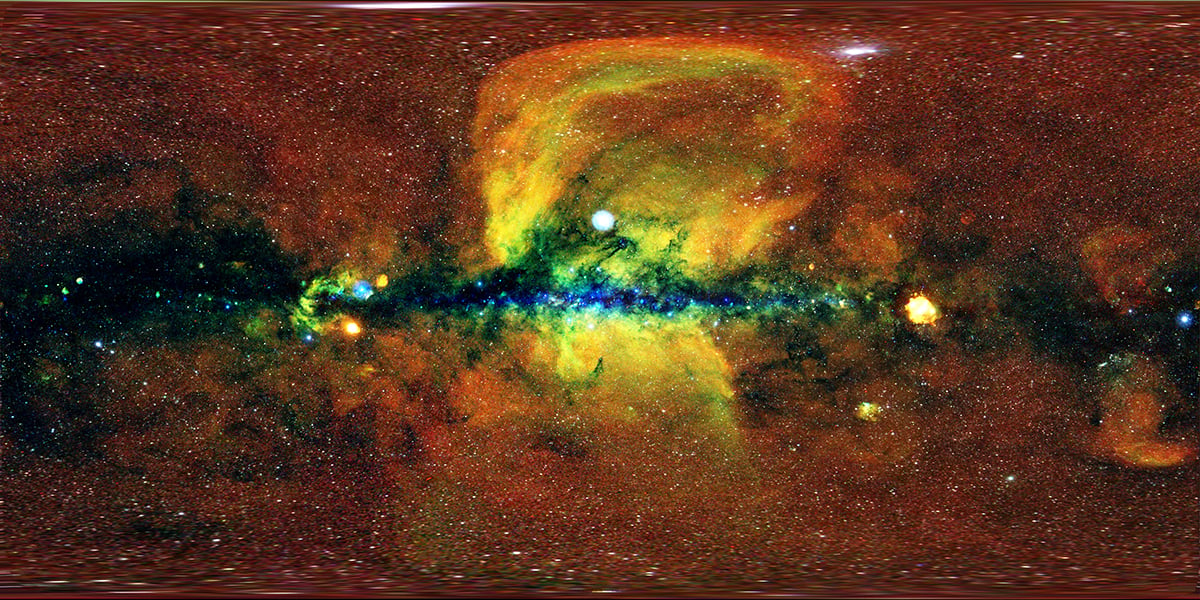
The first image uses data from eROSITA, the X-ray telescope aboard the Spektr-RG spacecraft. eROSITA detects X-rays from some of the hottest and most energetic environments in space.
Its first all-sky survey, known as eRASS1, produced a catalogue containing more than 930,000 X-ray sources. The survey covered the sky between 0.2 and 2.3 keV. That range includes emission from objects and structures that would remain invisible in an ordinary optical image.
Fermi shows a sky filled with gamma rays
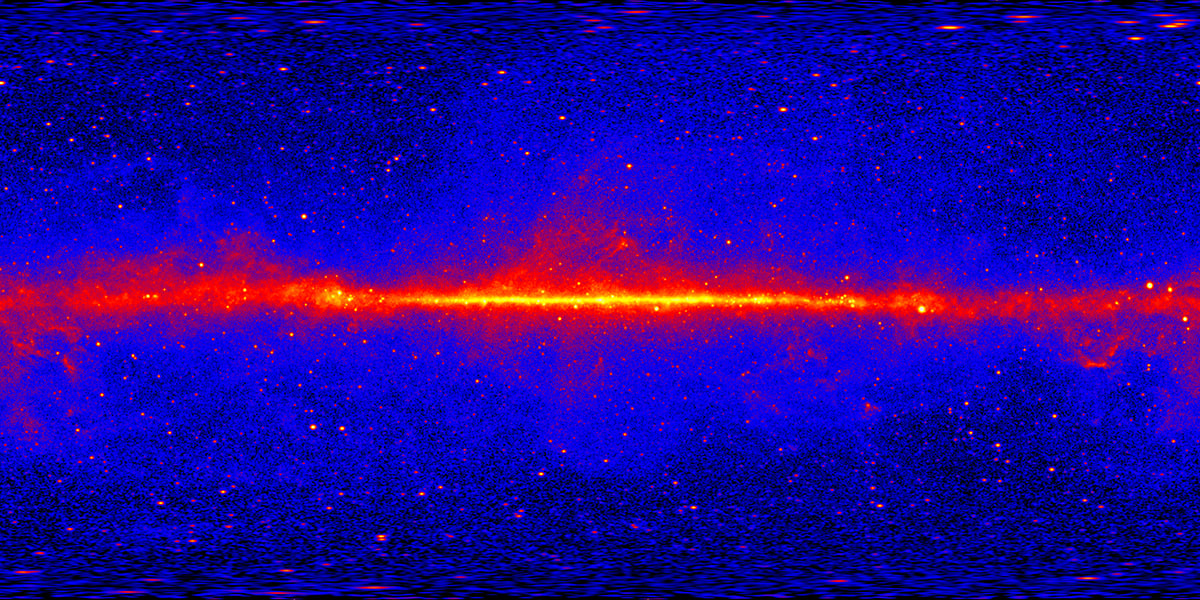
NASA’s Fermi Gamma-ray Space Telescope has spent years surveying the sky with its Large Area Telescope, or LAT. The LAT detects gamma rays from roughly 20 MeV to more than 300 GeV. Fermi scans a large portion of the sky during every orbit and can build up an all-sky picture over time.
The map contains bright sources away from the Galactic plane. Many belong to active galaxies with powerful central black holes. Pulsars, supernova remnants, and other energetic objects also contribute to the gamma-ray sky.
H-alpha reveals the Milky Way’s glowing hydrogen
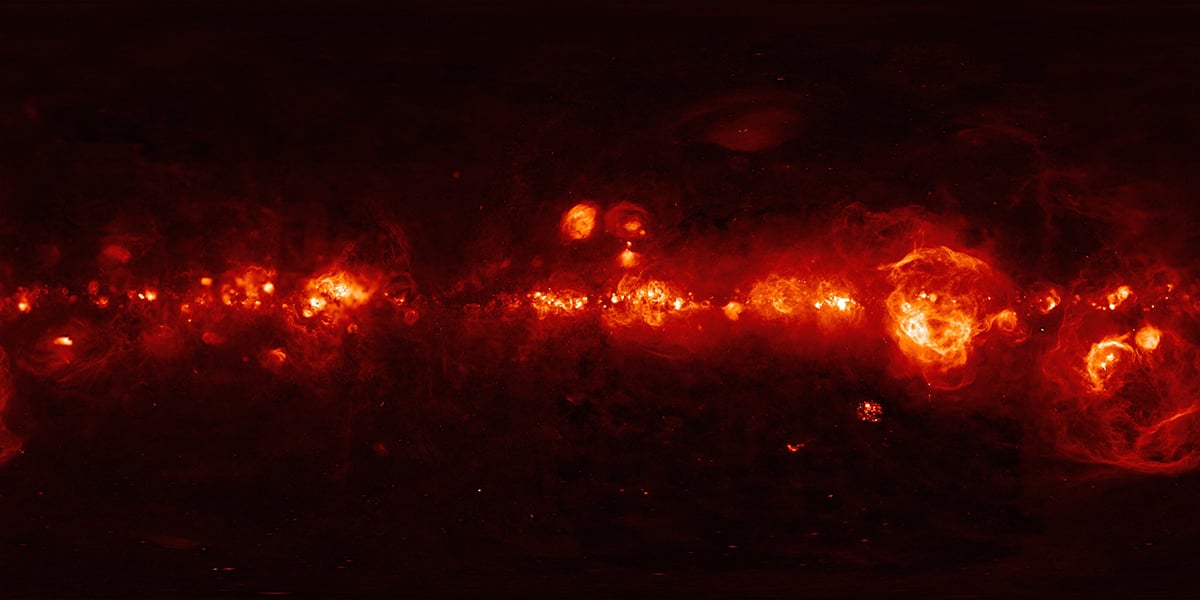
The next image focuses on hydrogen glowing at a wavelength of about 656 nanometers. This is H-alpha emission. Ionized hydrogen atoms produce it when electrons recombine with protons and move through specific energy states. Astronomers use H-alpha observations to trace large amounts of ionized gas across the Milky Way.
The image combines observations from three major H-alpha surveys. These include the Wisconsin H-Alpha Mapper, the Virginia Tech Spectral-Line Survey and the Southern H-Alpha Sky Survey Atlas.
Gaia turns billions of stars into one map
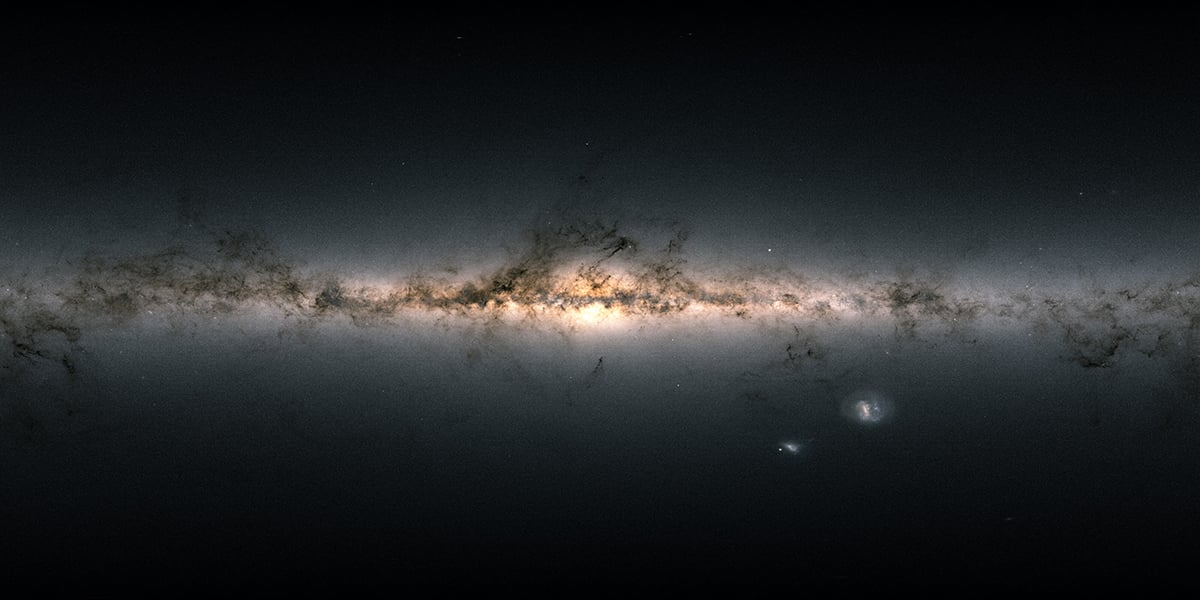
The European Space Agency’s Gaia mission has created one of the largest stellar catalogues ever assembled. Gaia DR3 contains 1,811,709,771 observed sources. The catalogue includes positions and other measurements that allow astronomers to study the structure and movement of stars across the Galaxy.
The Gaia image covers roughly 330 to 1100 nanometers. This range includes much of the visible spectrum and extends into the near-infrared.
HI4PI follows the hydrogen hidden behind the dust
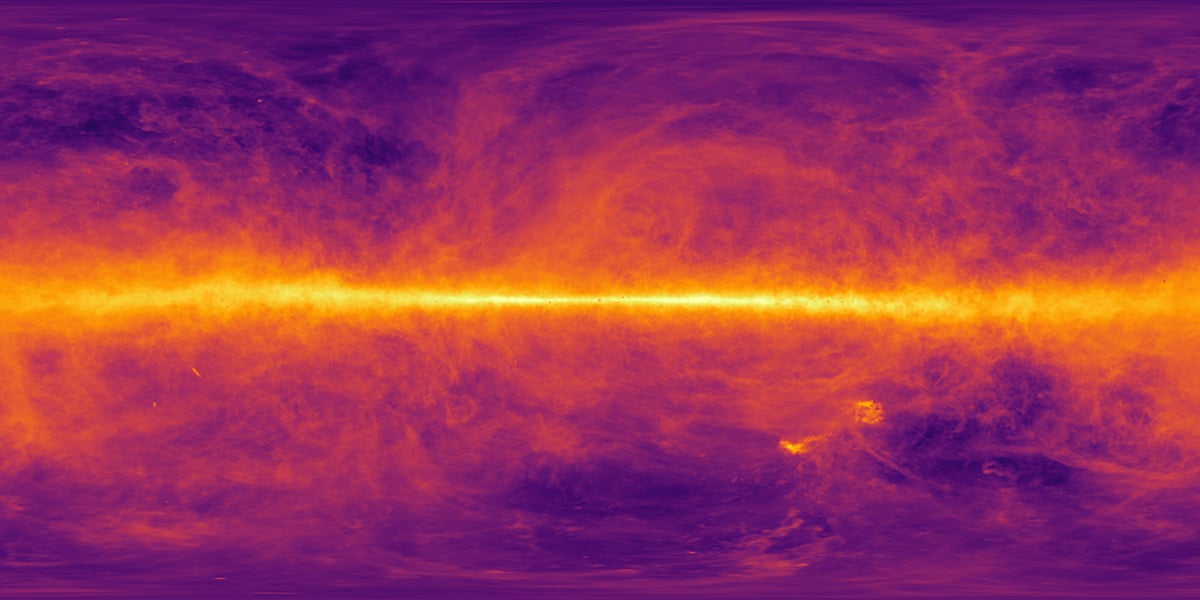
The next map leaves visible light behind and moves to radio wavelengths. It follows neutral atomic hydrogen using the 21-centimetre emission produced by hydrogen atoms.
The HI4PI survey combines observations from the Effelsberg-Bonn HI Survey and the Galactic All-Sky Survey. These observations cover the entire sky and provide a detailed map of neutral hydrogen. The 21-centimetre signal gives astronomers a way to study gas through regions where visible light struggles to pass.
Planck sees the sky in microwave light
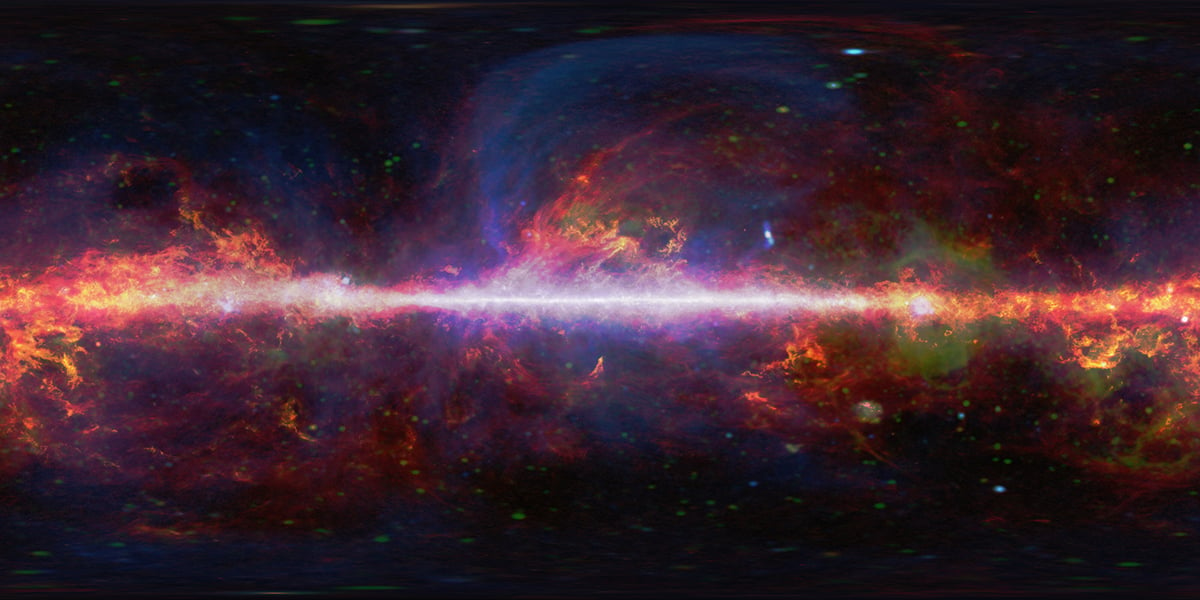
The Planck spacecraft observed the sky across nine microwave frequency bands, ranging from 30 to 857 GHz. Its observations cover the Milky Way as well as the much fainter background radiation that fills the Universe.
The Galactic plane remains prominent in the Planck map. Dust and gas produce microwave emission that traces structures within our Galaxy. Some of these features overlap with structures seen in the HI4PI image, but the two surveys measure different signals.
Away from the Galactic plane, we get to see another component: the cosmic microwave background, or CMB. This faint radiation comes from the early Universe and reaches us from every direction.
2MASS looks through some of the Milky Way’s dust
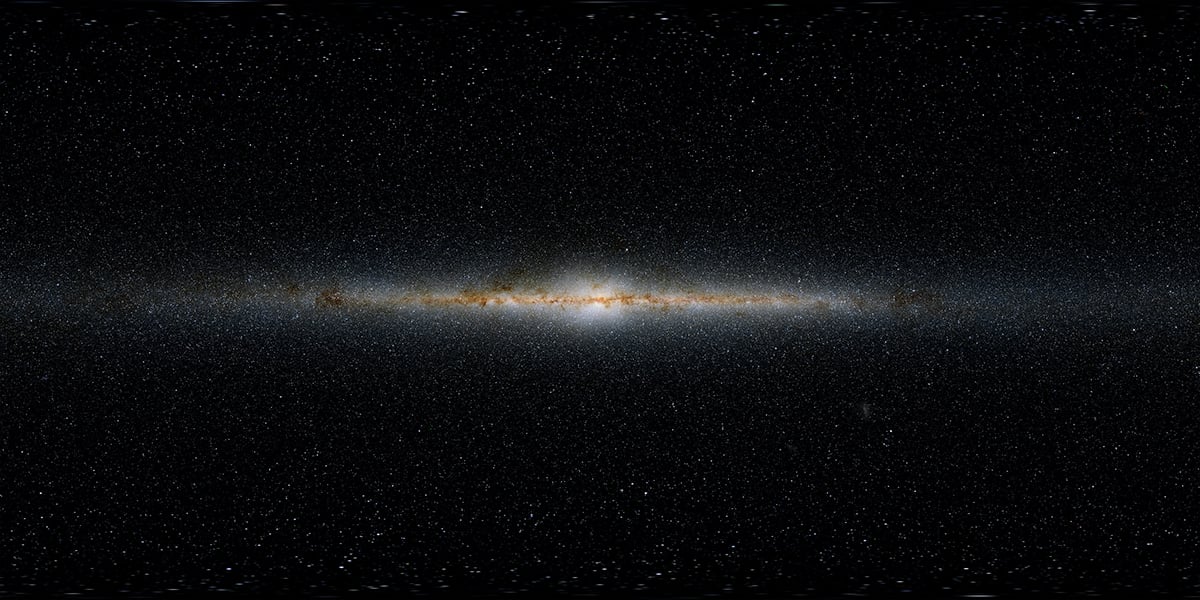
The 2MASS survey provides another view of the sky through infrared light. The survey operated from 1997 to 2001 and used two 1.3-metre telescopes, one in Arizona and another in Chile.
2MASS observed the entire sky in three near-infrared bands: J at about 1.25 micrometers, H at 1.65 micrometers, and Ks at 2.17 micrometers. Infrared light passes through dust more easily than visible light. This allows astronomers to detect many stars hidden behind dusty regions of the Milky Way.
The survey catalogued more than 300 million objects. These include stars, brown dwarfs, star clusters, nebulae, and galaxies.
SPHEREx: Another infrared map of the sky
The newest view in the collection comes from NASA’s SPHEREx mission. NASA launched the spacecraft in March 2025, beginning a mission designed to survey the entire sky in infrared wavelengths.
SPHEREx observes from about 0.75 to 5 micrometers. That overlaps with some of the wavelengths covered by older infrared surveys such as 2MASS. SPHEREx collects information across many wavelengths. Its spectroscopic measurements allow astronomers to study how an object’s light changes across the infrared spectrum.
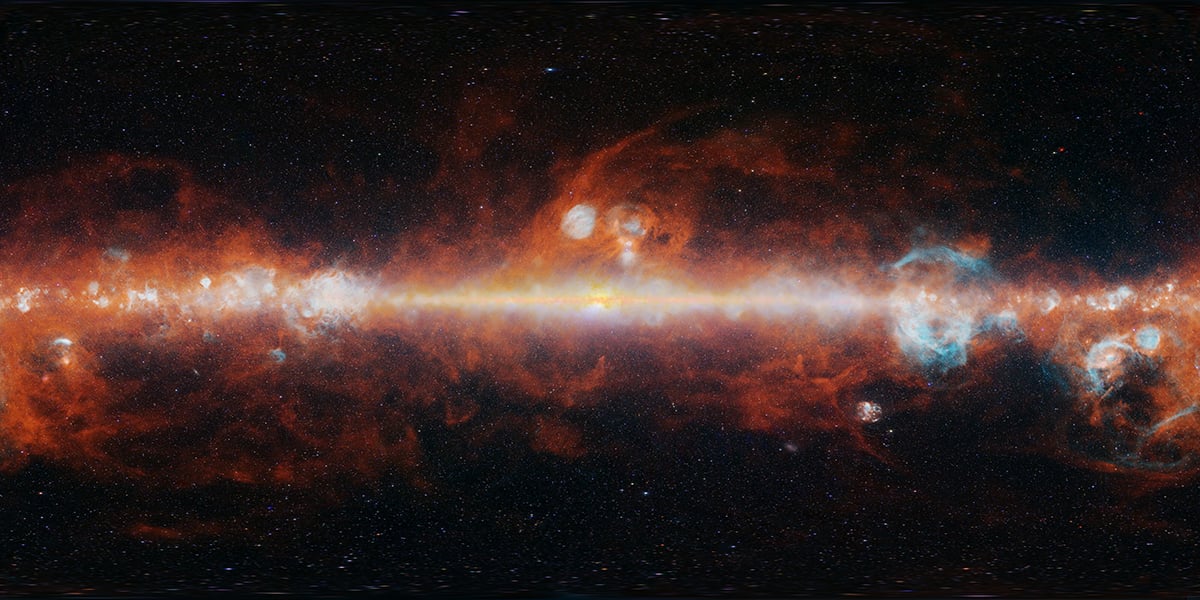
Which of these is your favourite view of the sky?
Clear skies!
See more from DIYPhotography.net on Google
Add DIYPhotography.net as a trusted source. This makes
our stories more likely to appear in your Google Search results.
 Add as a preferred source on Google

Soumyadeep Mukherjee
Soumyadeep Mukherjee is an award-winning astrophotographer from India. He has a doctorate degree in Linguistics. His work extends to the sub-genres of nightscape, deep sky, solar, lunar and optical phenomenon photography. He is also a photography educator and has conducted numerous workshops. His works have appeared in over 40 books & magazines including Astronomy, BBC Sky at Night, Sky & Telescope among others, and in various websites including National Geographic, NASA, Forbes. He was the first Indian to win “Astronomy Photographer of the Year” award in a major category.


Join the Discussion
DIYP Comment Policy
Be nice, be on-topic, no personal information or flames.