
















This is the Largest 2D Map of the Universe With 4 Billion Objects
Aug 15, 2026
Soumyadeep Mukherjee
Soumyadeep Mukherjee is an award-winning astrophotographer from India. He has a doctorate degree in Linguistics. His work extends to the sub-genres of nightscape, deep sky, solar, lunar and optical phenomenon photography. He is also a photography educator and has conducted numerous workshops. His works have appeared in over 40 books & magazines including Astronomy, BBC Sky at Night, Sky & Telescope among others, and in various websites including National Geographic, NASA, Forbes. He was the first Indian to win “Astronomy Photographer of the Year” award in a major category.
Share:
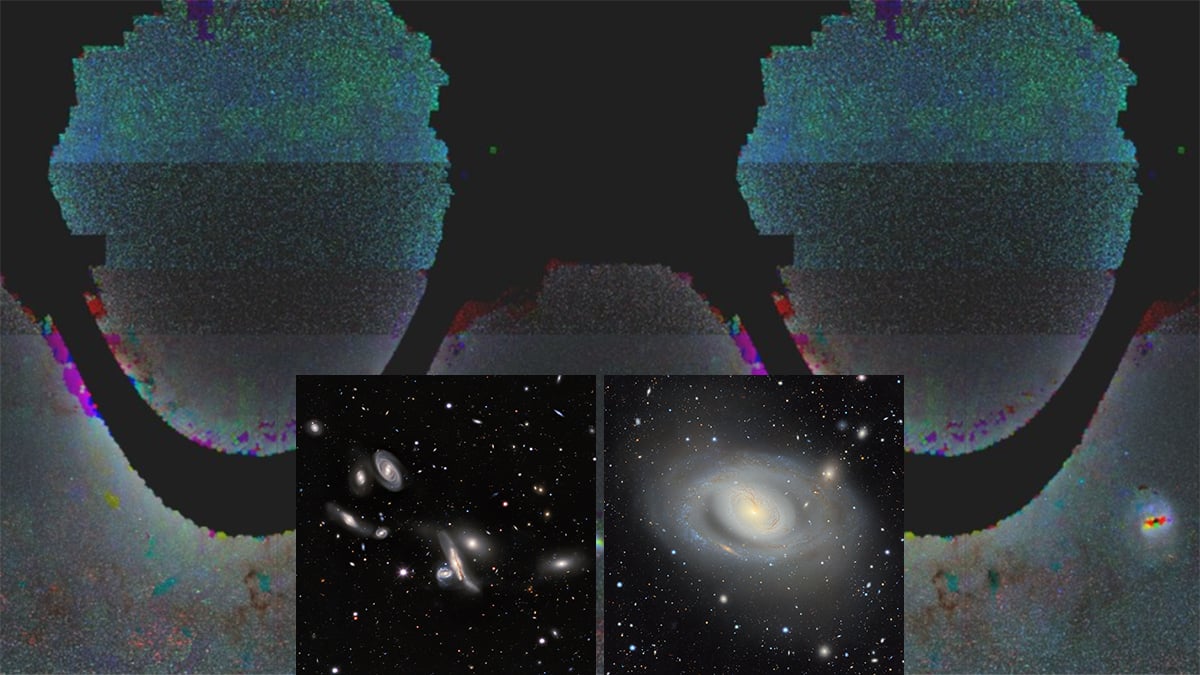
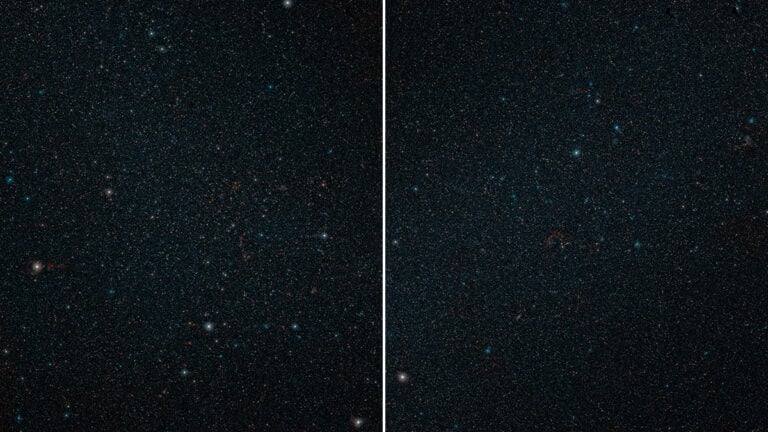
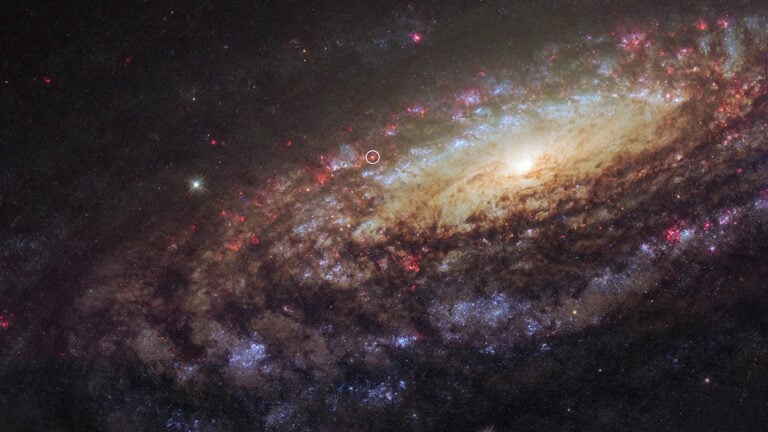
Do you remember the largest 3D map of the universe released a few months back? We now have something new, again. Astronomers have released the largest two-dimensional map of the universe ever assembled, combining 5.6 trillion pixels of imaging data into a single survey covering about 14,000 square degrees of sky. The DESI Legacy Imaging Surveys map contains nearly four billion detected celestial objects, including galaxies, stars and quasars.
The map is based on 263,407 individual exposures collected during 2,285 nights of observations. Those images were processed and calibrated before being combined into a uniform dataset. The survey covers roughly 75 percent of the sky, with most of its footprint lying away from the crowded plane of the Milky Way. This makes it particularly useful for studying distant galaxies and the large-scale distribution of objects beyond our Galaxy.
A detailed survey of the extragalactic sky
The new map is best understood as a large astronomical imaging survey rather than a single photograph. Each region of the sky has been observed through different filters, allowing astronomers to measure how bright an object appears at different wavelengths. Those measurements provide useful information about an object’s physical properties and help researchers distinguish between different classes of sources.
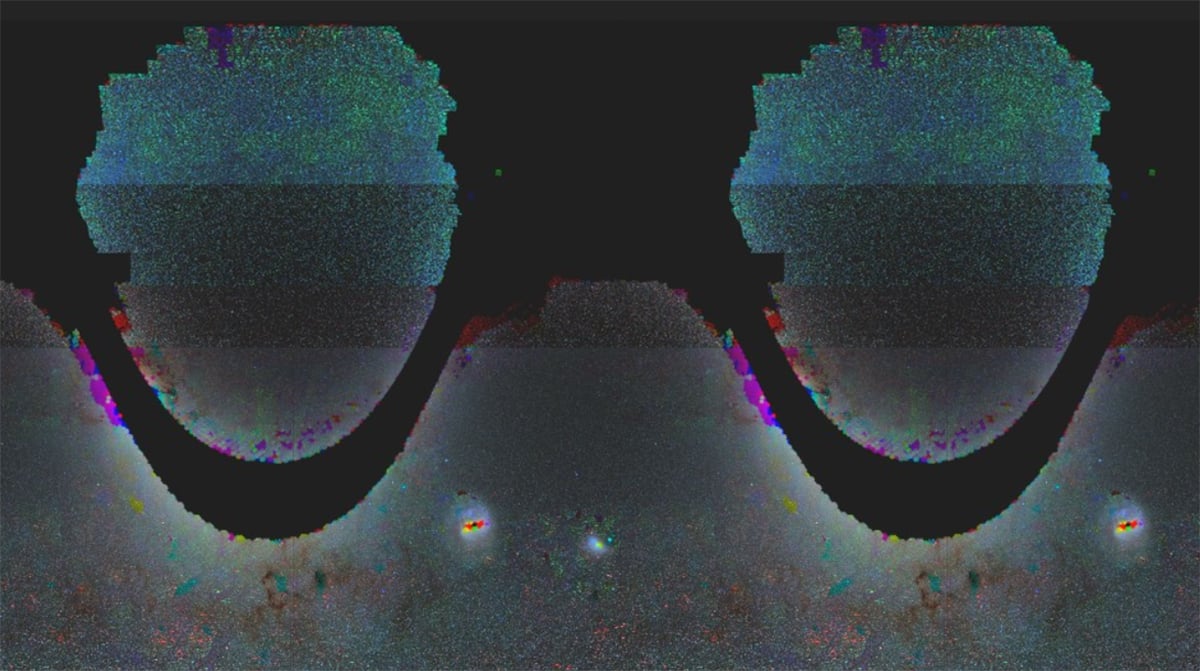
The survey covers more than 14,000 square degrees. Its footprint was selected mainly outside the Galactic plane, where the concentration of stars and interstellar dust makes observations of distant galaxies more difficult. From the survey’s perspective, the relatively clear extragalactic sky provides a much better field for building large samples of distant objects.
The imaging covers three optical bands known as g, r, and z. These filters sample different parts of visible and near-infrared light. The survey also incorporates infrared observations from WISE, which observed the sky at wavelengths much longer than those accessible to the optical cameras. The WISE W1 and W2 bands are centered at approximately 3.4 and 4.6 microns.
The map can be viewed through the interactive Legacy Survey Sky Viewer.
Hundreds of thousands of exposures for one map
Producing a map this large required considerably more work than placing individual photographs side by side. The final dataset contains 263,407 exposures collected during 2,285 nights. Each observation was affected by the conditions under which it was taken, including atmospheric seeing, transparency, and sky brightness.
The survey team developed software to process the individual exposures and place them onto a consistent photometric and astrometric framework. Photometric calibration ensures that measured brightnesses can be compared across the survey. Astrometric calibration determines accurate positions for the detected sources.
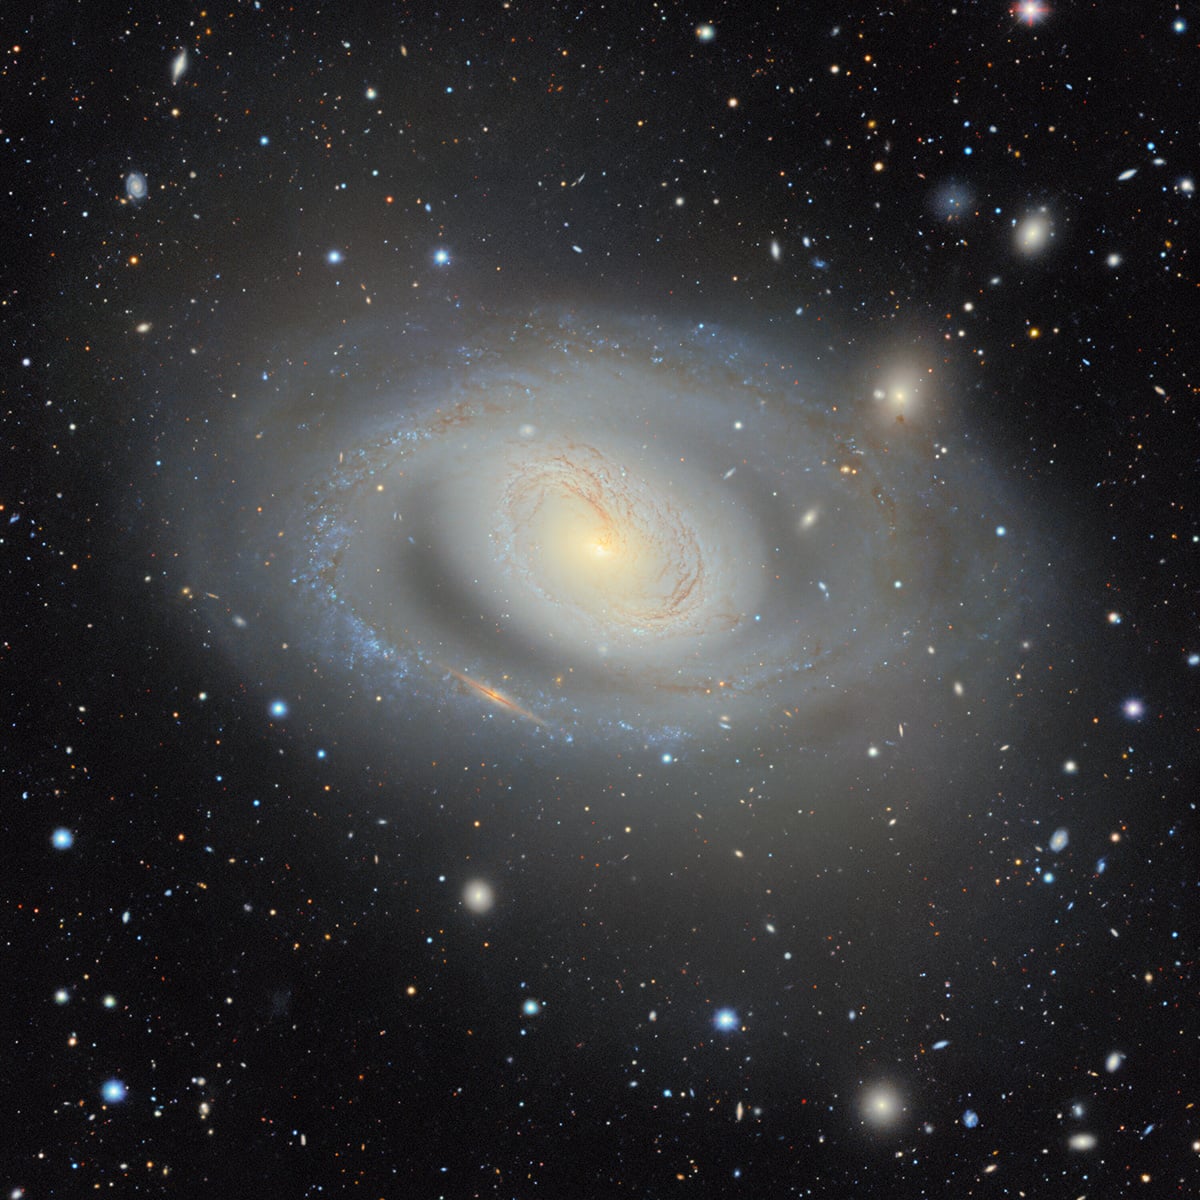
The processing effort required substantial computing resources. The team spent about a year developing the software needed for the complete dataset. Once the system was ready, processing the full collection took roughly eight weeks on the Perlmutter supercomputer at the National Energy Research Scientific Computing Center at Lawrence Berkeley National Laboratory.
More than 160 scientists contributed to collecting the observations, while a team of around 20 researchers worked on producing the final dataset. The finished map contains 5.6 trillion pixels, making it almost impractical to treat as a conventional image file.
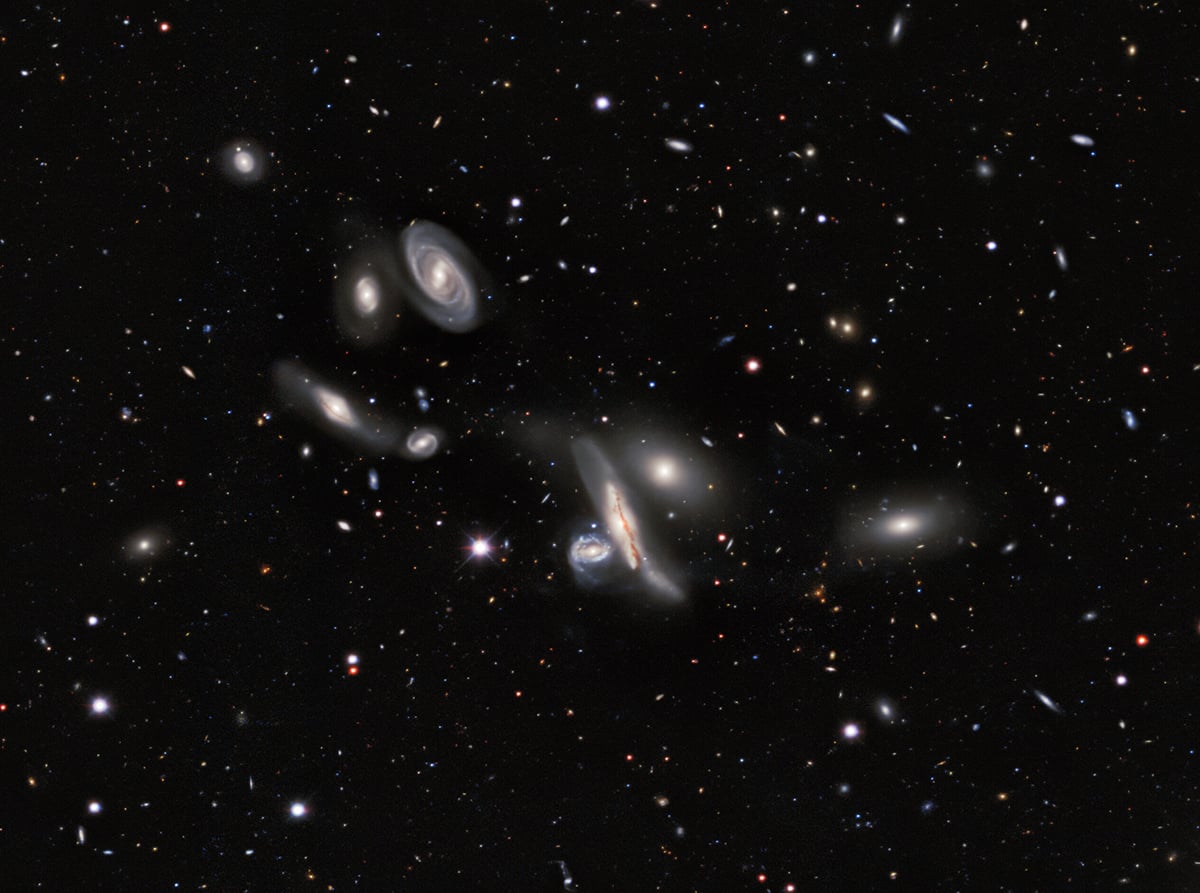
The three ground-based surveys behind the optical data
The optical component of the map comes from three major ground-based imaging surveys. Each used a different telescope and camera, and each contributed observations over a defined part of the DESI footprint. The teams later combined those datasets into a common imaging resource.
The largest component came from the Dark Energy Camera Legacy Survey, or DECaLS. It used the 4-metre Víctor M. Blanco Telescope at Cerro Tololo Inter-American Observatory in Chile, equipped with the Dark Energy Camera, or DECam. The camera was developed for wide-field imaging and contains a large mosaic of detectors. DECaLS observed its targets through the g, r, and z filters used in the final Legacy Surveys data.
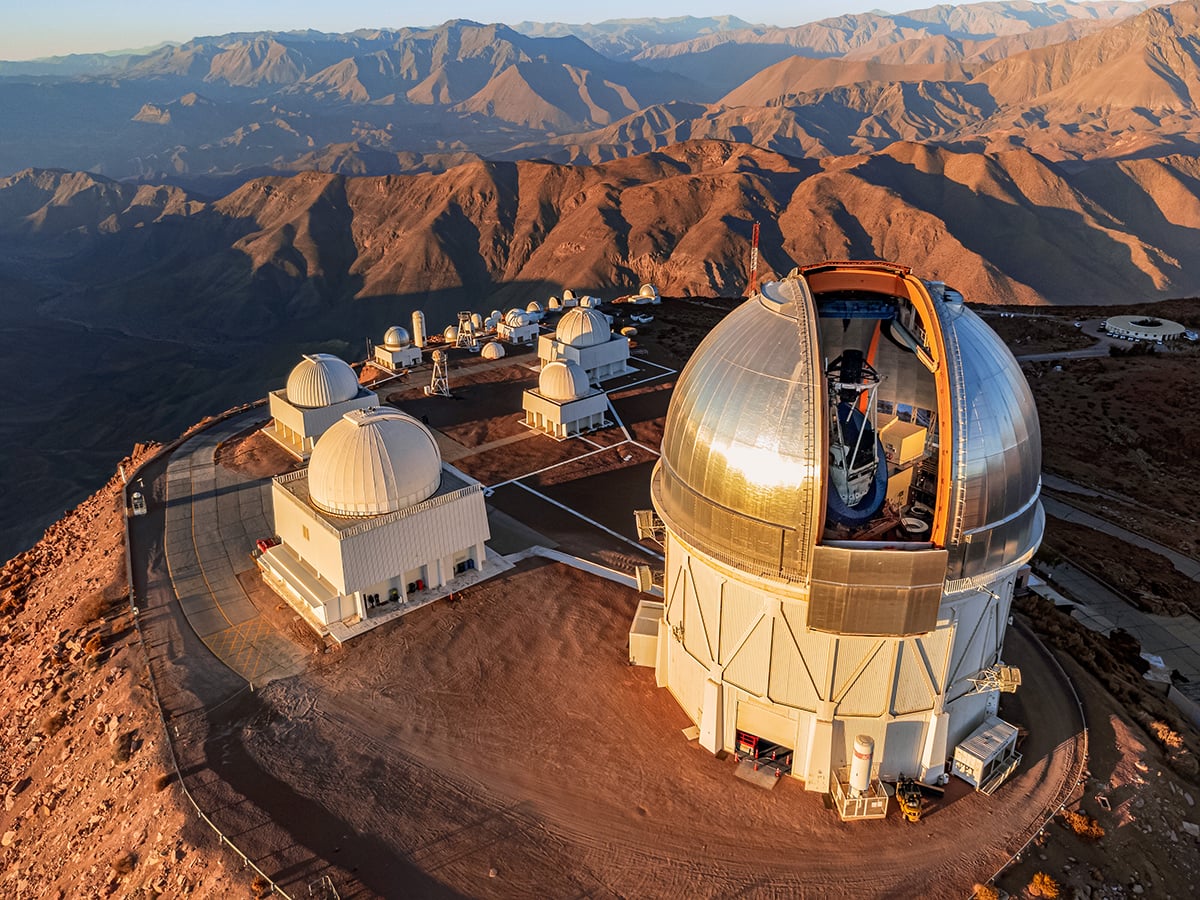
CTIO/NOIRLab/NSF/AURA/T. Matsopoulos
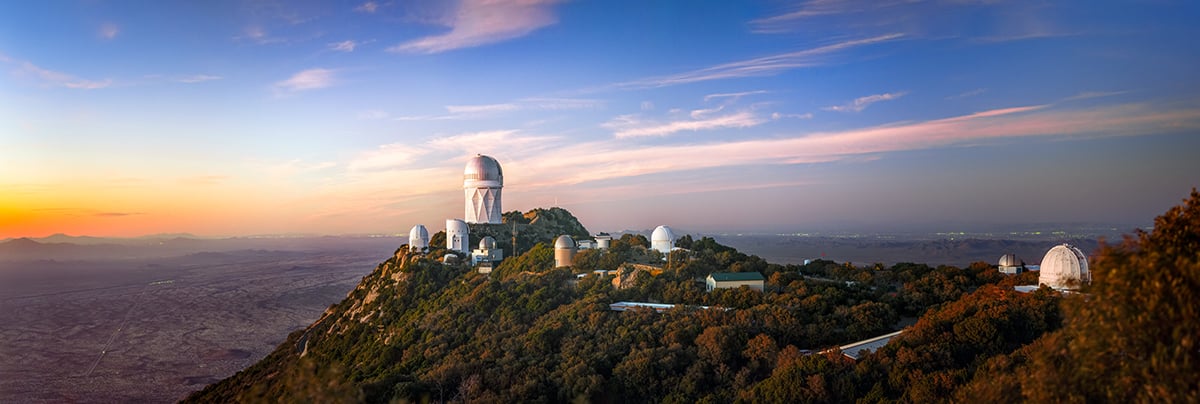
The northern part of the survey includes observations from the Mayall z-band Legacy Survey, or MzLS. This programme used the 4-metre Nicholas U. Mayall Telescope at Kitt Peak National Observatory in Arizona. Its observations concentrated on the z band, which samples light at longer wavelengths than the g and r bands.
The Beijing-Arizona Sky Survey, or BASS, supplied additional northern-sky imaging. It used the 2.3-metre Bok Telescope at Steward Observatory and covered approximately 5,100 square degrees of the North Galactic Cap. BASS observed in the g and r bands, complementing the z-band observations from MzLS.
Clear skies!
See more from DIYPhotography.net on Google
Add DIYPhotography.net as a trusted source. This makes
our stories more likely to appear in your Google Search results.
 Add as a preferred source on Google

Soumyadeep Mukherjee
Soumyadeep Mukherjee is an award-winning astrophotographer from India. He has a doctorate degree in Linguistics. His work extends to the sub-genres of nightscape, deep sky, solar, lunar and optical phenomenon photography. He is also a photography educator and has conducted numerous workshops. His works have appeared in over 40 books & magazines including Astronomy, BBC Sky at Night, Sky & Telescope among others, and in various websites including National Geographic, NASA, Forbes. He was the first Indian to win “Astronomy Photographer of the Year” award in a major category.
Join the Discussion
DIYP Comment Policy
Be nice, be on-topic, no personal information or flames.