


This is what your histogram is for and how to use it
Jun 13, 2016
John Aldred
John Aldred is a photographer with over 25 years of experience in the portrait and commercial worlds. He is based in Scotland and has been an early adopter – and occasional beta tester – of almost every digital imaging technology in that time. As well as his creative visual work, John uses 3D printing, electronics and programming to create his own photography and filmmaking tools and consults for a number of brands across the industry.
Share:

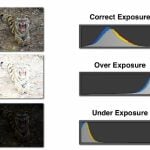
The histogram is based around a fairly simple principle, but one that many still struggle to get to grips with. Put simply, it’s a graph showing the relative proportion of brightness levels throughout your image.
In the latest video from Rocket Jump Film School, cinematographer Jon Salmon talks us through exactly what the histogram is and how to interpret it effectively to get the best out of your camera.
The video above does primarily focus on using the histogram to get the perfect video exposure, but the principles don’t change when shooting stills. The tips and information contained applies equally to stills photographers.
One thing alluded to in the video is the “Live Histogram”. This is basically a histogram that you can see while you’re looking at your scene with liveview (or an EVF), rather than after you’ve created your image.
Unfortunately, not all cameras (mostly Nikons) support the Live Histogram. So, your only real options are to shoot using an external HDMI monitor which provides a live histogram, such as the Aputure VS 2 FineHD, or shooting tethered to a desktop, tablet, or laptop using something like digiCamControl (free, but Windows only).
The histogram can be your best friend once you fully understand it, and at worst it’ll help to reinforce the results of other metering methods.
Do you use the histogram to meter for stills or video? If not, how do you prefer to do it? In camera reflective spot meter? Matrix/Evaluative metering? Or a handheld incident meter like a Sekonic? Let us know in the comments.

John Aldred
John Aldred is a photographer with over 25 years of experience in the portrait and commercial worlds. He is based in Scotland and has been an early adopter – and occasional beta tester – of almost every digital imaging technology in that time. As well as his creative visual work, John uses 3D printing, electronics and programming to create his own photography and filmmaking tools and consults for a number of brands across the industry.


Join the Discussion
DIYP Comment Policy
Be nice, be on-topic, no personal information or flames.
9 responses to “This is what your histogram is for and how to use it”
Not sure it is applicable one-to-one for still shooting. There is one more variable in the still capture which is shutter speed. The live view is shot at a constant speed (frames per second, 30, 60, etc) so the histogram you see on the live view is based that speed, hence it does not represent the image when taken at a different shutter speed which you would in a typical situation. You might as well take a shot and check the histogram in playback.
Regardless of framerate, the actual shutter speed is still that at which you’d shoot a still. The liveview histogram is based on that shutter speed. It simply updates as often as the framerate.
If you’re shooting at 1/2000th of a second @ 24fps, the liveview screen will show 1/2000th of a second slices of time, 24 times a second, and the histogram will update for that 1/2000th slice of time.
If you change your shutter speed, the liveview display, and consequently the histogram, will change based on the new shutter speed.
Your shutter speed is not locked. It can be controlled independently of framerate, and it’s the shutter speed that determines exposure and histogram. :)
The only real exception is if you’re shooting a longer shutter speed than is availablea at a given framerate. For example, if you want to shoot a 2 second exposure, the liveview histogram would be useless, but you can always just take that 2 second shot, and look at the histogram from the resulting image.
The principles still apply. :)
Looks like some of the newer cameras indeed have this capability (exposure preview mode) to check on the histogram in the liveview. I stand corrected.
Probably most now. I know Nikon introduced at least as far back as 2010 with the D7000 (not sure if the D3s had it).
My D7100 does not seem to have it. Could not find anything on the manual.
That’s strange.
I just grabbed one of my D7000 bodies. In the “Shooting Menu”, there’s “Movie Settings”. Inside there it should be the bottom option “Manual movie settings”.
Not the most descriptive name, I grant you. :)
Nope. There is no live view histogram in D7100.
No live histogram, no. Sorry, I thought you were still talking about manual exposure preview on liveview. :)
You’d need an external HDMI monitor with a live histogram, or USB tethering software like digCamControl.
Hi,
Great video, thank you for sharing! I made a Photo Extension Histogram app for Apple Photos for the iPhone and iPad. I hope you like it!
Photo Extension Histogram
https://itunes.apple.com/us/app/photo-extension-histogram/id1084416191?mt=8
Aldo