


Gaia Creates First 3D Map of Stellar Nurseries in the Milky Way
Sep 19, 2025
Soumyadeep Mukherjee
Soumyadeep Mukherjee is an award-winning astrophotographer from India. He has a doctorate degree in Linguistics. His work extends to the sub-genres of nightscape, deep sky, solar, lunar and optical phenomenon photography. He is also a photography educator and has conducted numerous workshops. His works have appeared in over 40 books & magazines including Astronomy, BBC Sky at Night, Sky & Telescope among others, and in various websites including National Geographic, NASA, Forbes. He was the first Indian to win “Astronomy Photographer of the Year” award in a major category.
Share:

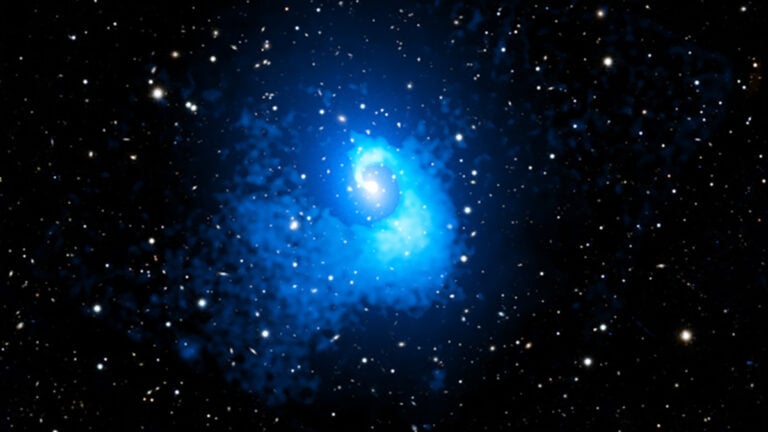
Astronomers have long studied the glowing clouds where stars are born. Telescopes have revealed stunning shapes and vivid colors, but these views are flat. They show what lies in the sky, not how objects are arranged in space. That limitation has now changed. Using the European Space Agency’s Gaia mission, scientists have built the most accurate three-dimensional map of stellar nurseries in our part of the Milky Way.
The map spans about 4,000 light-years around the Sun. It combines Gaia’s measurements of 44 million ordinary stars with observations of 87 rare, massive O-type stars. The result is a fly-through that lets us look around our cosmic neighborhood from a new perspective. For the first time, we can see how giant clouds of gas and dust connect in 3D, and how hot young stars shape their surroundings.
How Gaia turns star data into a 3D map
Gaia was not designed to take pictures of nebulae. Instead, it measures the position, brightness, and motion of stars with extraordinary precision. From that data, astronomers can work out distances to individual stars. They can also measure how much of a star’s light is blocked by intervening dust, a quantity called extinction. When these extinction values are plotted across space, they reveal the structure of dust clouds.
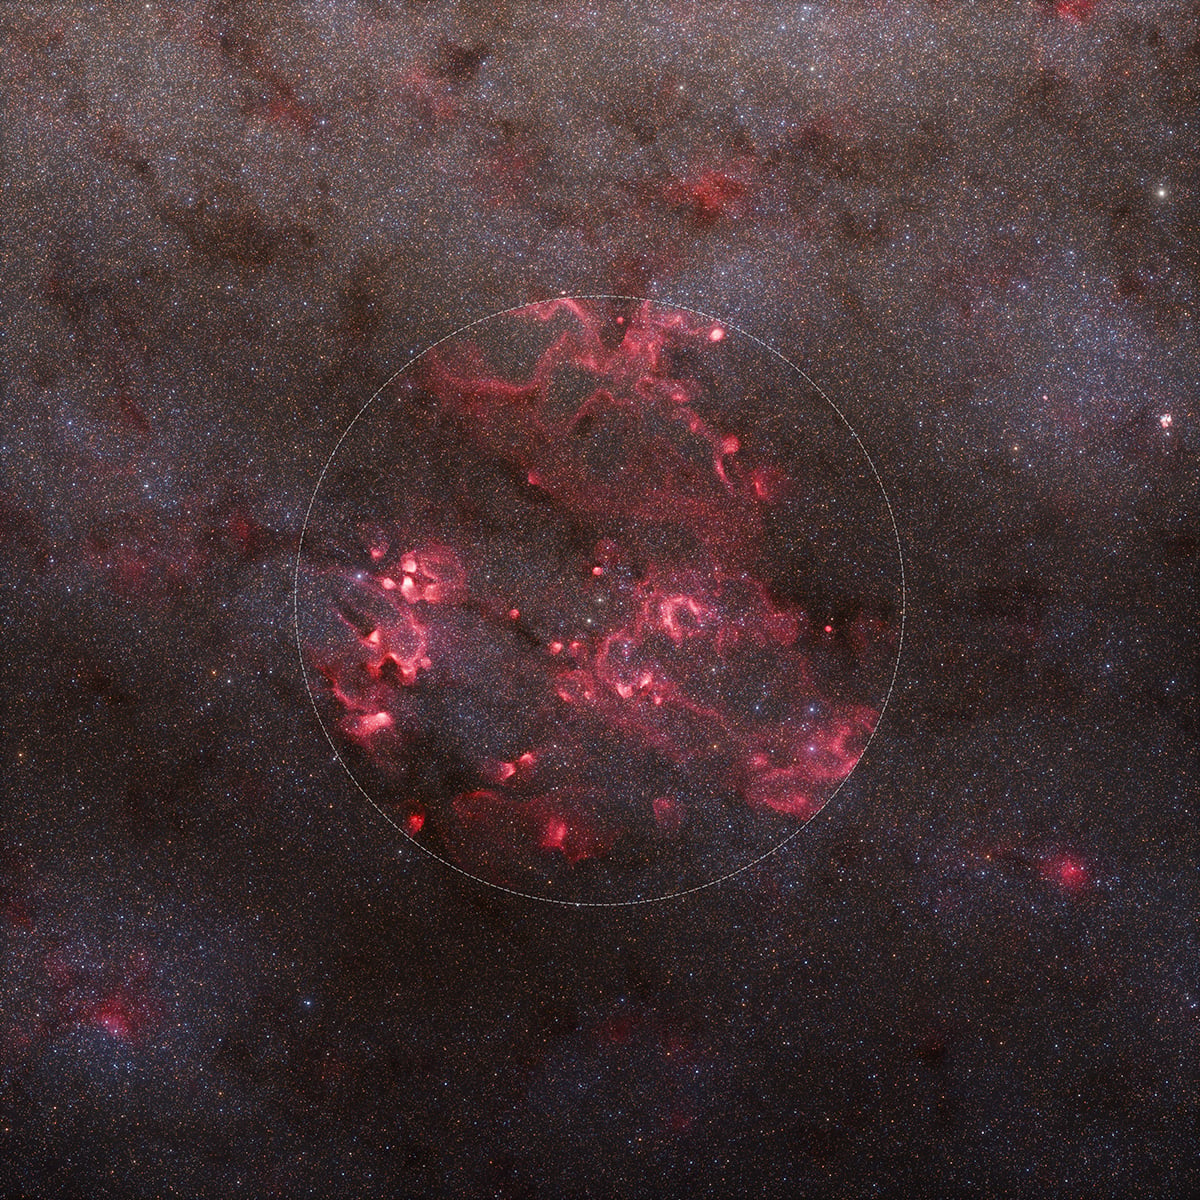
But dust alone does not tell the whole story. O-type stars add the missing piece. These massive stars shine strongly in ultraviolet light. Their radiation ionises hydrogen gas, producing glowing regions called H II regions. By mapping the locations of O stars and combining them with dust maps, researchers can trace both the solid and ionised components of stellar nurseries. The result is a 3D model that reproduces what radio and optical surveys have long hinted at, but in far greater detail.
Familiar nebulae in a new light
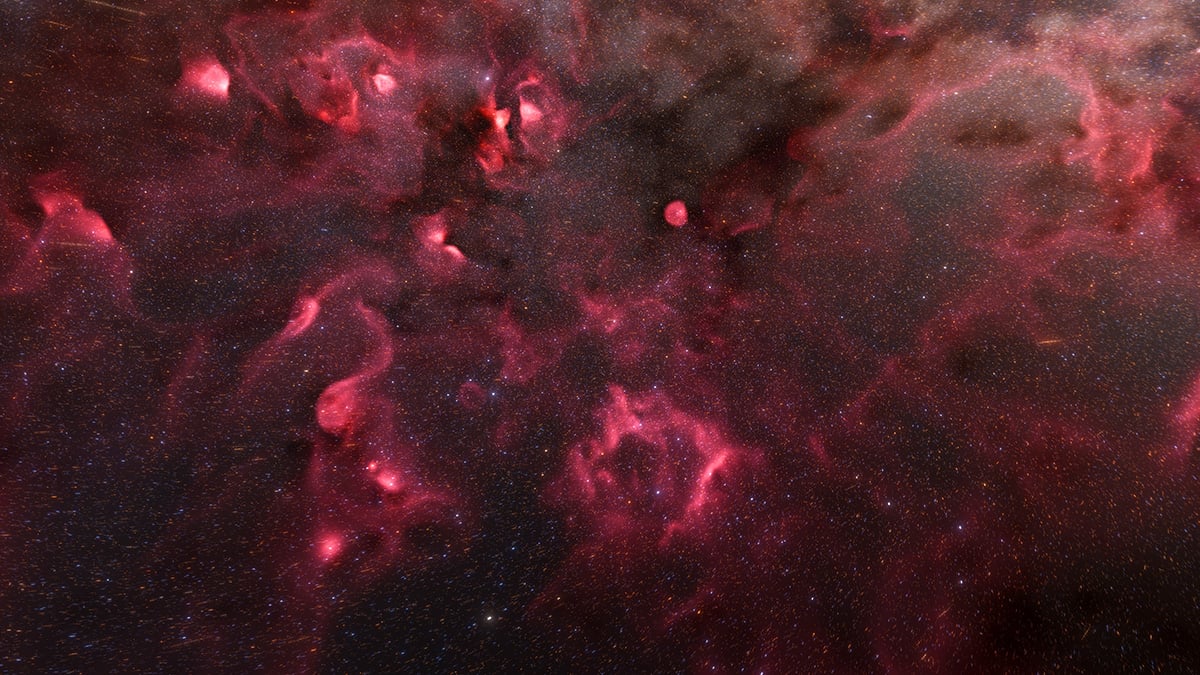
The fly-through includes regions that are well known to stargazers and astrophotographers. The Orion-Eridanus superbubble, the Gum Nebula, the California Nebula, and the North American Nebula all appear in the new maps. From Earth, these objects are seen as bright patches on the night sky. In Gaia’s reconstruction, they gain depth and context.
The Orion-Eridanus superbubble, for example, is revealed as a vast cavity surrounded by filaments of dust and gas. Some clouds appear to have ruptured, venting material into a larger cavity in the interstellar medium. Such details help explain how stellar winds and radiation from massive stars sculpt their environment. The maps reveal that many features previously thought to be isolated are, in fact, connected in three-dimensional space.
Star-formation studies
Studying how stars form requires understanding the environment around them. Gas and dust provide the raw material. Radiation from hot stars can compress nearby gas and trigger new star formation, or it can clear gas away and halt the process. Until now, astronomers had to infer these interactions from flat images. The new 3D model lets them see how far the influence of O stars reaches, and how cavities and bubbles overlap.
Building the map: data and computation
The technical foundation of this achievement is a high-resolution dust map of the local galaxy. Earlier work produced detailed reconstructions out to about 1,250 parsecs (roughly 4,000 light-years). Lewis McCallum and colleagues combined these dust maps with Gaia’s precise distances to O stars. They then applied radiative transfer models to predict how hydrogen gas should glow when ionised.
The results match well with existing H-alpha surveys, which trace ionised hydrogen at a wavelength of 656 nanometers. Where differences appear, scientists gain clues about missing data or physics. Producing the map required immense computing power, since the reconstruction works at parsec-scale resolution across a huge volume of space. The effort resulted in the most faithful 3D view of local star formation ever created.
Upcoming Gaia data release
As impressive as the current map is, it covers only a fraction of the Milky Way. Four thousand light-years sounds vast, but the galaxy is about 100,000 light-years across. Expanding the 3D view to larger distances will need more data and more computing power.

The upcoming Gaia Data Release 4 (DR4) will include longer observations, better astrometry, and improved photometric data. That will sharpen extinction measurements, add more stars to the catalogue, and refine O-star distances. With those improvements, the maps can be extended and made more detailed. Over time, astronomers hope to build a near-continuous 3D model of the Milky Way’s star-forming regions.
Clear skies!

Soumyadeep Mukherjee
Soumyadeep Mukherjee is an award-winning astrophotographer from India. He has a doctorate degree in Linguistics. His work extends to the sub-genres of nightscape, deep sky, solar, lunar and optical phenomenon photography. He is also a photography educator and has conducted numerous workshops. His works have appeared in over 40 books & magazines including Astronomy, BBC Sky at Night, Sky & Telescope among others, and in various websites including National Geographic, NASA, Forbes. He was the first Indian to win “Astronomy Photographer of the Year” award in a major category.


Join the Discussion
DIYP Comment Policy
Be nice, be on-topic, no personal information or flames.